Abstract:This post uses statistics collected real-time by hand collated into graphs to definitively prove that the fishing rate was miscalculated by Red before the nerf, and is still being miscalculated after the nerf, and that the rate at which fishing has been reduced for the Ugly Duckling Rod is not 25%
Aims: The aims of this investigation were to;
-
Determine how the Ugly Duckling Rod’s 3 reels affects the rate at which fish are caught
-
Establish whether dividing the catch rate in ticks by 3 produces an accurate representation of the catch rate for the Ugly Duckling Rod’s three reels.
Method: A stopwatch was used to time the length of time it took for a fish to be caught. The stopwatch was started the moment the hook was cast and was stopped the moment the fish bit the hook and the sploosh noise played. This was repeated 100 times and the length of time for each catch was recorded. This as repeated for four different rods producing 4 data sets and graphs.
The rods Investigated are as following: Ugly Duckling Rod, Luga Reel, Captain Hook Reel (Lure 5), Lure IV(Lure 4)
Bait was not used during the investigation. The investigation was halted during any stormy nights. Shrek’s luck, while not playing a factor in the rate of catch, was also not used during the investigation.
Results:
The data tables themselves are far too long to post here, However they are available upon request and can be viewed in either Microsoft Office Excel or OpenOffice Calc.
Mean Averages (Sum of datapoints divided by number of datapoints. Time in seconds)
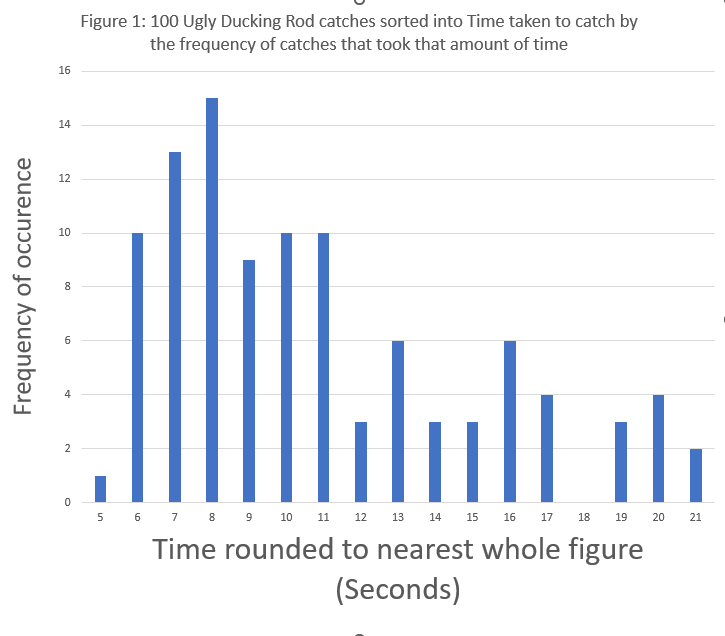
The Mean Average for Ugly Duckling Rod was 10.498 seconds
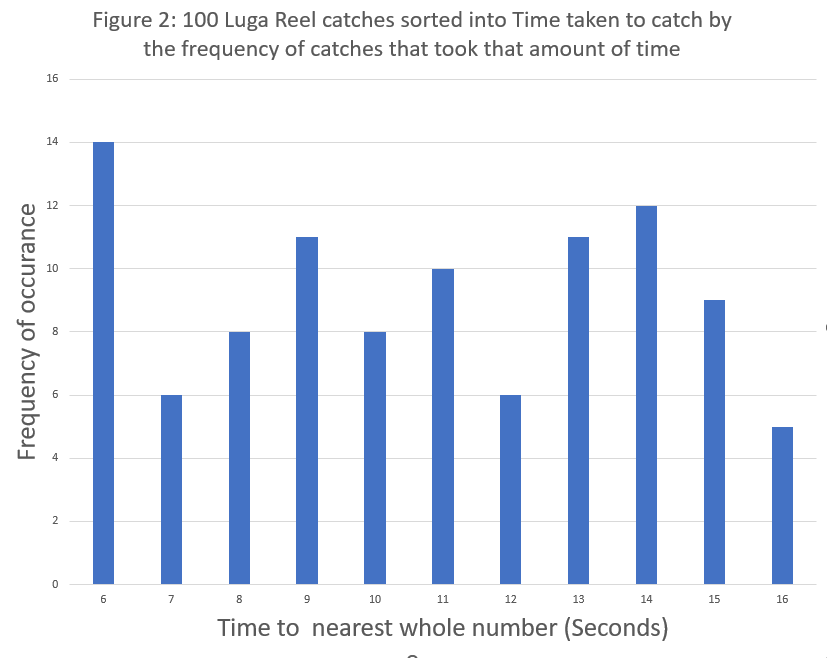
The Mean Average for Luga Reel was 10.774 seconds
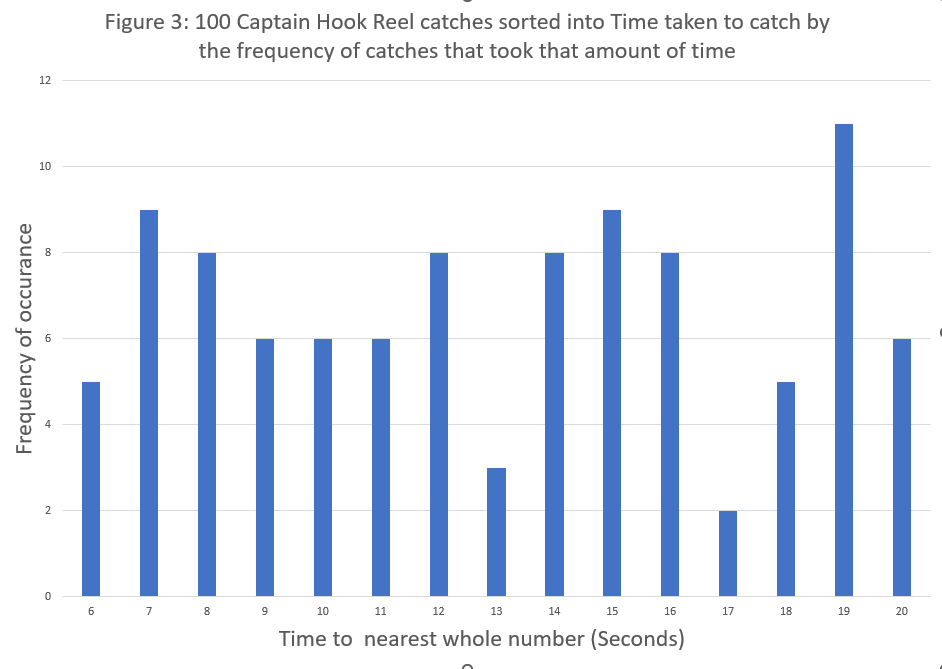
The Mean Average for Captain Hook’s Reel (Lure 5) was 13.028 seconds
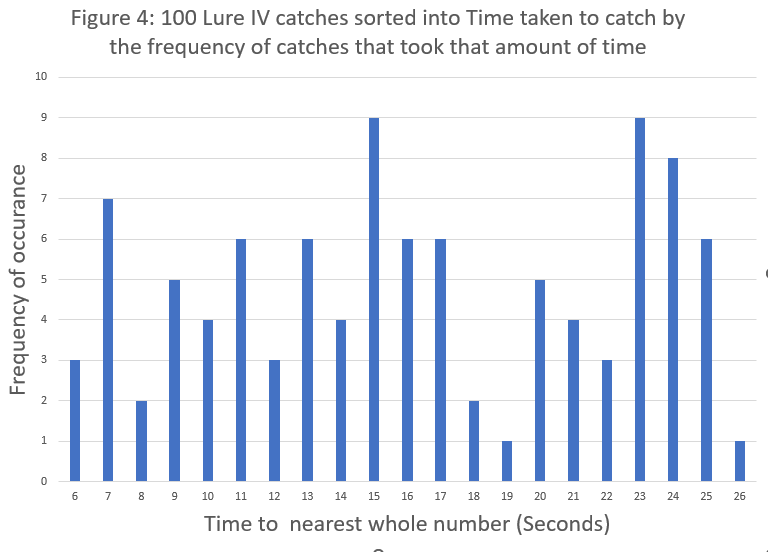
The Mean Average for Lure IV(Lure 4) was 16.175 seconds.
Graphs
Ugly Duckling Rod
This graph shows a significant positive skew deviating from normal distribution. It’s modal category sits at the peak of curve.
Luga Reel
This graph shows a normal distribution with a high degree of variance. It’s modal category is seemingly random.
Captain Hook’s Reel
This graph sees a normal distribution with a high degree of variance. It’s modal category is seemingly random.
Lure IV (Lure 4)
This graph sees a normal distribution with a high degree of variance. It’s modal category is seemingly random.
Conclusion:
Without the dataset from the lure 5 UD rod, the degree to which the rod has been nerfed cannot be said with confidence. The data clearly shows that dividing the rate of a lure 4 rod by 3 does not equal the rate at which the Ugly Duckling Rod fishes as can be seen by making a ratio from the mean average times.
10.498s/16.175s=0.649 (not 0.33 or even close)
Thus Red’s model for determining how effective the Rod was, and the degree to which the nerf would effect it by, is 100% proven to be inaccurate by a large margin.
This is because 3 lures changes the distribution of catches to a positive skew. This functions in a very different way to simply having 3x catches, which is why it’s difficult to determine.
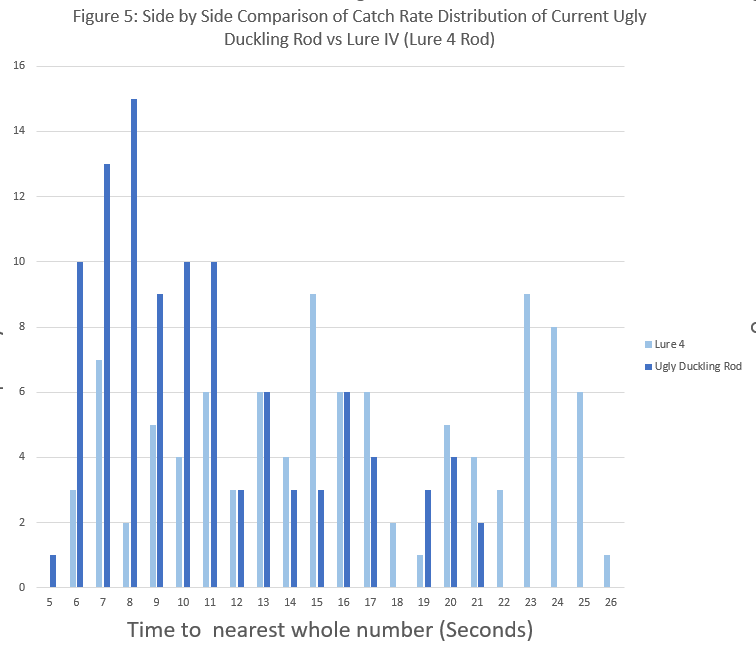
This Graph shows Figure 1 and Figure 4 on the same axes. This allows for a comparison between 3 lure 4 reels and 1 and perhaps a prediction as to what a similar graph for the pre-nerf UD rod might have looked like.
The maximum time taken to catch a fish with Lure 4 was 26 seconds. This isn’t seen on the UD Rod graph, however as they are the same lure, we know it is theoretically possible. It also matches anecdotes from fishers yesterday. With a larger sample size, the positive skew could would be much more obvious and the max catch time would appear on the statistics.
With the modal category being 8 seconds for the Post-Nerf UD rod, by comparing Figure 5 with the data seen in Figure 3 it’s likely the modal category for the Pre-Nerf UD rod would have been around 5-6 seconds.
We would have seen a tighter distribution across a smaller number of categories, meaning the positive skew would be far more apparent. By increasing the number of categories, the skew is stretched out and the bell curve has to some extent been flattened. This adds up to a significant decrease in the Rod’s output.
Final words: Red can’t do maths and if munchy was some big budget triple AAA videogames developer they’d have paid some mug to do all this statistics for them, but Red, Varm and a few other goofballs are all we got.
No need to thank me for proving you wrong, it was a pleasure, just as it was last time with the Elder Wand.